Market Outlook
March 14, 2017
Market Cues
Domestic Indices
Chg (%)
(Pts)
(Close)
Indian markets are likely to open on positive note after the election results.
BSE Sensex
0.1
17
28,946
US stocks remained flat as investors awaited the rate hike by the Federal Reserve.
Nifty
0.1
8
8,935
Investors strongly expect that the Federal Reserve will announce a rate hike after its
Mid Cap
(0.3)
(34)
13,366
meeting on Wednesday. Shares of Intel were down 2.3 percent after announcing
Small Cap
(0.1)
(16)
13,605
that it planned to buy Mobileye. Health care stocks were down slightly over
Bankex
(0.0)
(2)
23,626
uncertainties over the Republicans replacement for Obamacare.
UK stocks closed slightly positive as mining stocks recovered due to higher
Global Indices
Chg (%)
(Pts)
(Close)
commodity prices. UK house prices increased at their fastest pace in past twelve
months in the month of February. House prices grew 0.6 percent in February MoM
Dow Jones
(0.1)
(21)
20,881
due to higher prices in London. Mining stocks rallied strongly as copper prices
Nasdaq
0.2
14
5,876
recovered. Anglo American went up by 4.12 percent and Rio Tinto added 3.96
FTSE
0.3
24
7,367
percent. Also, BHP Billiton and Glencore rose by 2.49 and 1.40 percent respectively.
Nikkei
1.5
286
19,605
Indian markets closed flat on Friday after opening positive in the morning.
Hang Seng
0.3
67
23,569
Uncertainty over the election results from various states acted as a dampener to
Shanghai Com
(0.1)
(4)
3,213
investor sentiment. Further caution was also caused by the pending release of the
industrial output data.
Advances / Declines
BSE
NSE
News Analysis
Advances
1,144
654
Hindustan Zinc to invest `1,000cr in two more zinc fumer plants
Declines
1,674
973
Detailed analysis on Pg2
Unchanged
178
98
Investor’s Ready Reckoner
Volumes (` Cr)
Key Domestic & Global Indicators
BSE
7,509
Stock Watch: Latest investment recommendations on 150+ stocks
NSE
17,336
Refer Pg5 onwards
Top Picks
Net Inflows (` Cr)
Net
Mtd
Ytd
CMP
Target
Upside
Company
Sector
Rating
(`)
(`)
(%)
FII
1,937
8,594
19,033
Amara Raja Batteries Auto & Auto Ancillary
Buy
828
1,009
21.8
MFs
(848)
(1,189)
5,881
HCL Tech
IT
Buy
845
1,000
18.4
Power Grid Corp.
Power
Accumulate
193
223
15.8
Top Gainers
Price (`)
Chg (%)
Navkar Corp.
Others
Buy
165
265
60.4
Centralbk
98
9.5
KEI Industries
Others
Buy
170
207
21.9
Iifl
389
6.4
More Top Picks on Pg3
Jindalstel
126
6.1
Key Upcoming Events
Supremeind
1,045
5.7
Previous
Consensus
Date
Region
Event Description
Pvr
1,424
5.7
Reading
Expectations
Mar 14 India
Monthly Wholesale Prices YoY%
5.25
6.10
Mar 14 India
Exports YoY%
4.30
--
Top Losers
Price (`)
Chg (%)
Mar 15 US
Monthly Wholesale Prices YoY%
1.10
--
Manappuram
91
(4.5)
Mar 15 India
Imports YoY%
10.70
--
Muthootfin
338
(3.9)
Mar 15 UK
Jobless claims change
(42.40)
--
Religare
215
(2.9)
Mar 15 US
Consumer price index (mom)
0.60
0.00
Petronet
378
(2.8)
Mar 15 US
FOMC rate decision
0.75
1.00
Techm
476
(2.7)
More Events on Pg4
As on March 10, 2017
Market Outlook
March 14, 2017
News Analysis
Hindustan Zinc to invest `1,000cr in two more zinc fumer plants
Hindustan Zinc, one of the lowest-cost zinc producers in the world, will be investing
another `1,000cr to set up two more zinc fumer plants over the next two-three
years. A zinc fumer plant extracts metal from waste products.
The company had invested `570cr in its first zinc fumer plant at Chanderiya
Hydro-II plant in Rajasthan. This plant is expected to start by Q1FY19.
The plant will help increase recovery of zinc to 97.5 per cent from 96.8 per cent (at
present) and push will volumes of lead produced by 4,700 tonnes and silver by 33
tonnes per annum.
The two new fumer plants will be funded through internal accruals. Hindustan Zinc
has an overall current capacity to produce about 825,000 tonnes of zinc, 180,000
tonnes of lead and about 500 tonnes of silver per year.
Economic and Political News
Lok Sabha passes the Admiralty Bill 2016
Cost overrun for 287 infra projects reaches `166,000cr
Steel exports increase 150 percent YoY in month of February
Rajya Sabha passes Enemy Property Bill
BJP wins clear majorities in UP and Uttarakhand, Congress in Punjab
Corporate News
Mphasis to buyback 1.73cr equity shares worth about `1,103cr
Reliance Capitals CEO Sam Ghosh to leave on March 31
Delhi High Court overturns order restricting Britannia from using the colour
blue in their packaging of NutriChoice Zero digestive biscuits
Car sales rise 4.9% YoY in February, passenger vehicles up 9% YoY
SpiceJet and Jet Airways raise concerns with the Civil Aviation Ministry over
move to allow foreign players to set up airlines in the country
Two-wheeler sales to close FY17 with 7-8% growth: ICRA
Market Outlook
March 14, 2017
Top Picks
Large Cap
Market Cap
CMP
Target
Upside
Company
Rationale
(` Cr)
(`)
(`)
(%)
To outpace battery industry growth due to better technological
Amara Raja Batteries
14,151
828
1,009
21.8
products leading to market share gains in both the
automotive OEM and replacement segments.
Strong growth in domestic business due to its leadership in
Alkem Laboratories
23,554
1,970
2,257
14.6
acute therapeutic segment. Alkem expects to launch more
products in USA, which bodes for its international business.
The stock is trading at attractive valuations and is factoring all
HCL Tech
1,19,227
845
1,000
18.4
the bad news.
Back on the growth trend, expect a long term growth of 14%
Infosys
2,34,311
1,020
1,249
22.4
to be a US$20bn in FY2020.
Strong order backlog and improvement in execution would
Larsen & Toubro
1,39,194
1,492
1,634
9.5
trigger the growth for the L&T
One of the largest pharma companies with strong
Lupin
65,314
1,447
1,809
25.1
international presence. It has a rich pipeline of ANDAs which
is also one of the largest among the generic companies.
Going forward, we expect the company to report strong top-
Power Grid Corporation
1,00,734
193
223
15.8
line CAGR of ~16% and bottom-line CAGR of ~19% over
FY16-18 on back of strong capitalization guidance
Source: Company, AngelResearch
Mid Cap
Market Cap
CMP
Target
Upside
Company
Rationale
(` Cr)
(`)
(`)
(%)
We expect the company would report strong profitability
Asian Granito
859
286
351
22.9
owing to better product mix, higher B2C sales and
amalgamation synergy.
Among the top 4 players in the consumer durables segment.
Bajaj Electricals
2,992
296
295
(0.2)
Improved profitability backed by turn around in E&P segment.
Strong order book lends earnings visibility.
Favourable outlook for the AC industry to augur well for
Cooling products business which is out pacing the market
Blue Star
5,245
549
634
15.5
growth. EMPPAC division's profitability to improve once
operating environment turns around.
With a focus on the low and medium income (LMI) consumer
Dewan Housing Finance
10,193
326
350
7.5
segment, the company has increased its presence in tier-II &
III cities where the growth opportunity is immense.
Strong loan growth backed by diversified loan portfolio and
Equitas Holdings
5,475
162
235
44.9
adequate CAR. ROE & ROA likely to remain decent as risk of
dilution remains low. Attractive valuations considering growth.
Economic recovery to have favourable impact on advertising
& circulation revenue growth. Further, the acquisition of a
Jagran Prakashan
6,152
188
225
19.5
radio business (Radio City) would also boost the company's
revenue growth.
High order book execution in EPC segment, rising B2C sales
KEI Industries
1,321
170
207
21.9
and higher exports to boost the revenues and profitability
Speedier execution and speedier sales, strong revenue visibilty
Mahindra Lifespace
1,532
373
522
39.9
in short-to-long run, attractive valuations
Higher growth in domestic branded sales and healthy export
Mirza International
1,063
88
107
21.1
to boost the profitability.
Massive capacity expansion along with rail advantage at ICD
Navkar Corporation
2,356
165
265
60.4
as well CFS augurs well for the company
Market leadership in Hindi news genre and no. 2 viewership
ranking in English news genre, exit from the radio business,
TV Today Network
1,520
255
344
35.0
and anticipated growth in ad spends by corporates to benefit
the stock.
Source: Company, Angel Research
Market Outlook
March 14, 2017
Key Upcoming Events
Global economic events release calendar
Bloomberg Data
Date
Time
Country
Event Description
Unit
Period
Last Reported
Estimated
Monthly Wholesale Prices YoY%
% Change
Feb
5.25
6.10
Mar 14, 2017 12:00 PM India
India
Exports YoY%
% Change
Feb
4.30
Mar 15, 2017
US
Producer Price Index (mom)
% Change
Feb
1.10
India
Imports YoY%
% Change
Feb
10.70
3:00 PM
UK
Jobless claims change
% Change
Feb
-42.40
6:00 PM
US
Consumer price index (mom)
% Change
Feb
0.60
0.00
11:30 PM
US
FOMC rate decision
%
Mar 15
0.75
1.00
Mar 16, 2017
6:00 PM
US
Initial Jobless claims
Thousands
Mar 11
243.00
3:30 PM Euro Zone
Euro-Zone CPI (YoY)
%
Feb F
2.00
2.00
6:00 PM
US
Housing Starts
Thousands
Feb
1246.00
1255.00
6:00 PM
US
Building permits
Thousands
Feb
1293.00
1253.00
5:30 PM
UK
BOE Announces rates
% Ratio
Mar 16
0.25
0.25
Mar 17, 2017
6:45 PM
US
Industrial Production
%
Feb
-0.25
0.20
Mar 21, 2017
7:30 PM
US
Existing home sales
Million
Feb
5.69
5.59
March 22, 2017 3:00 PM
UK
CPI (YoY)
% Change
Feb
1.80
Mar 23, 2017
8:30 PM
Euro Zone
Euro-Zone Consumer Confidence
Value
Mar A
-6.20
7:30 PM
US
New home sales
Thousands
Feb
555.00
562.50
Mar 24, 2017
2:00 PM Germany
PMI Services
Value
Mar P
54.40
2:00 PM Germany
PMI Manufacturing
Value
Mar P
56.80
Mar 28, 2017
7:30 PM
US
Consumer Confidence
S.A./ 1985=100 Mar
114.80
Mar 30, 2017
6:00 PM
US
GDP Qoq (Annualised)
% Change
4Q T
1.90
Mar 31, 2017
1:25 PM Germany
Unemployment change (000's)
Thousands
Mar
(14.00)
6:30 AM China
PMI Manufacturing
Value
Mar
51.60
51.20
2:00 PM
UK
PMI Manufacturing
Value
Mar
54.60
Monthly Wholesale Prices YoY%
% Change
Feb
5.25
6.10
Mar 14, 2017 12:00 PM India
Source: Bloomberg, Angel Research
Market Outlook
March 14, 2017
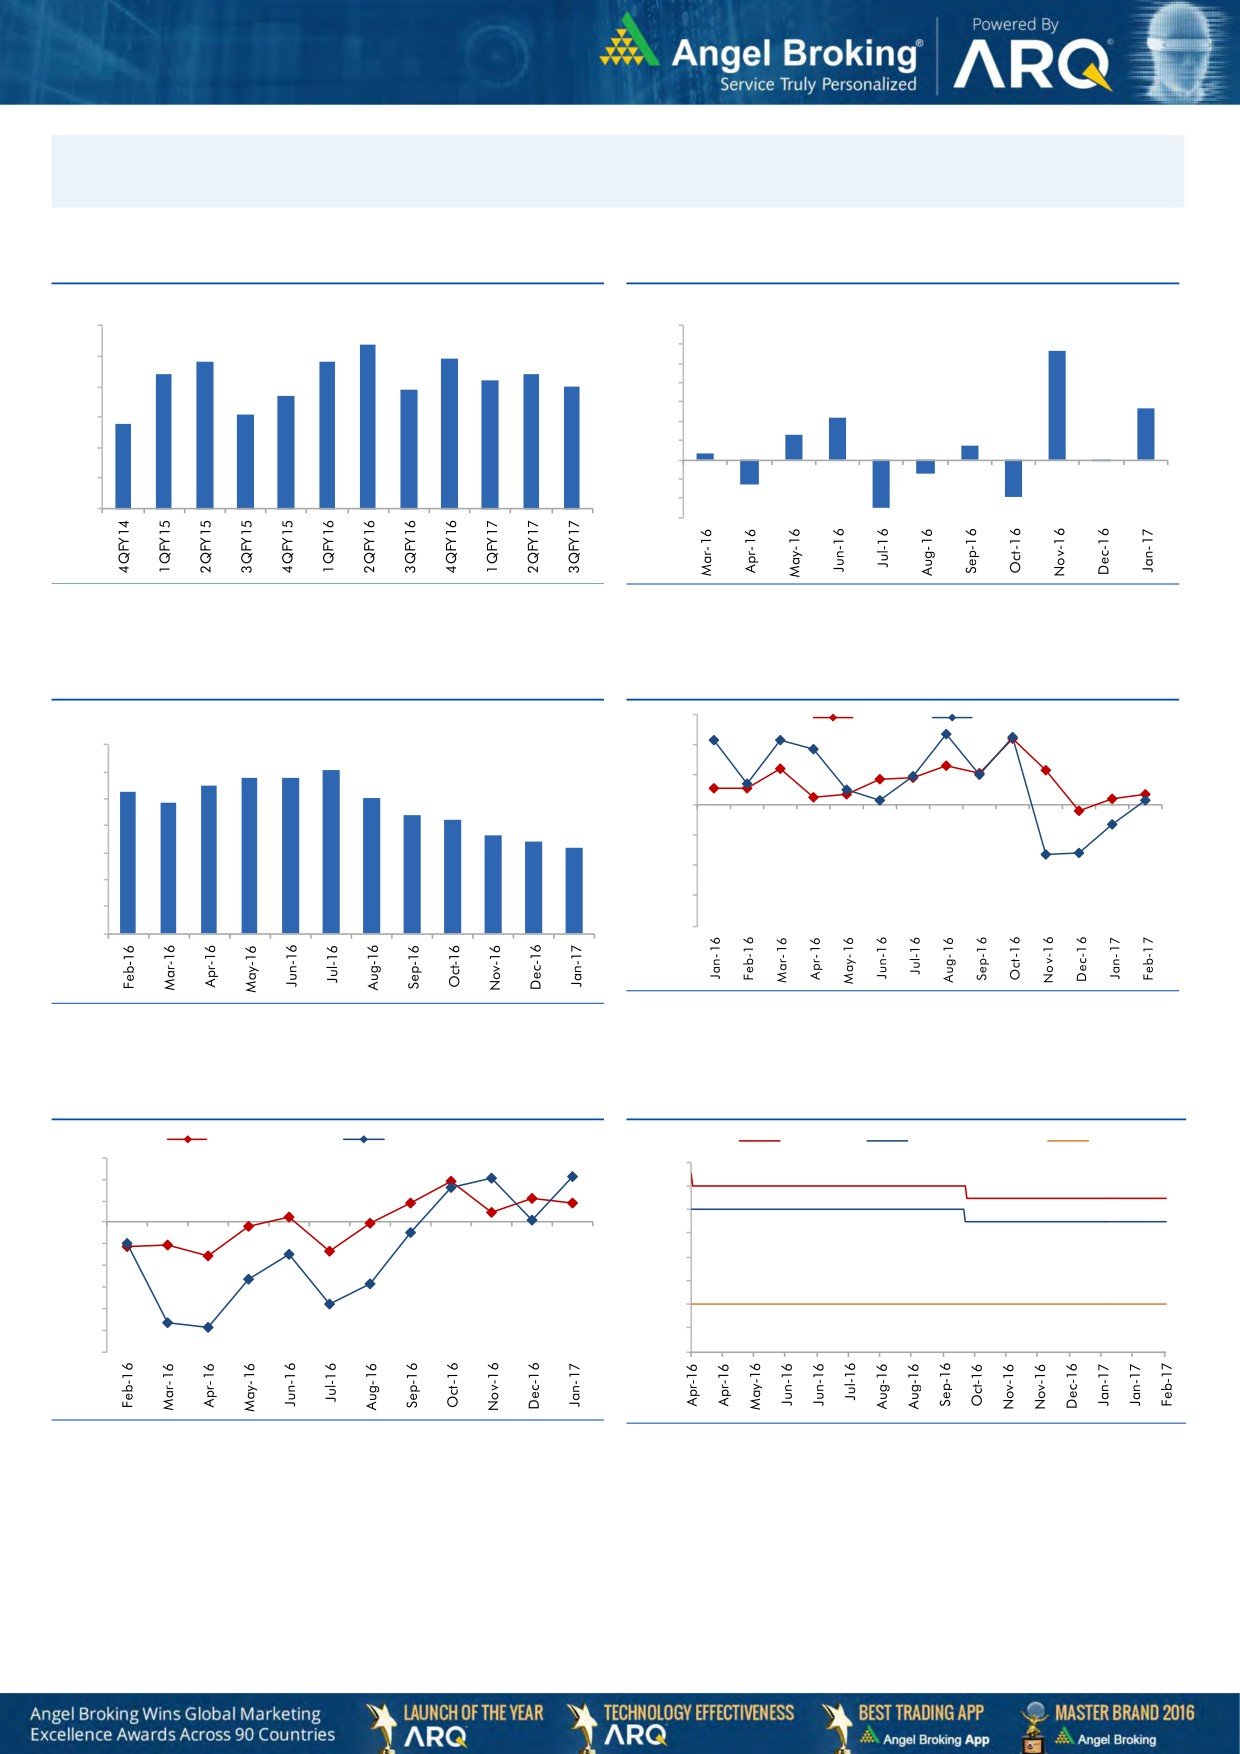
Macro watch
Exhibit 1: Quarterly GDP trends
Exhibit 2: IIP trends
(%)
(%)
9.0
8.4
7.0
5.7
7.8
7.8
7.9
6.0
8.0
7.4
7.4
7.2
5.0
6.9
7.0
6.7
4.0
7.0
2.7
6.1
3.0
2.2
5.8
6.0
2.0
1.3
0.7
1.0
0.3
5.0
-
4.0
(1.0)
(0.1)
(0.7)
(2.0)
3.0
(1.3)
(3.0)
(1.9)
(2.5)
Source: CSO, Angel Research
Source: MOSPI, Angel Research
Exhibit 3: Monthly CPI inflation trends
Exhibit 4: Manufacturing and services PMI
56.0
Mfg. PMI
Services PMI
(%)
7.0
54.0
6.1
5.8
5.8
6.0
5.5
5.3
5.1
52.0
4.8
5.0
4.4
4.2
50.0
3.6
4.0
3.4
3.2
48.0
3.0
46.0
2.0
44.0
1.0
42.0
-
Source: Market, Angel Research; Note: Level above 50 indicates expansion
Source: MOSPI, Angel Research
Exhibit 5: Exports and imports growth trends
Exhibit 6: Key policy rates
(%)
Exports yoy growth
Imports yoy growth
(%)
Repo rate
Reverse Repo rate
CRR
15.0
7.00
10.0
6.50
5.0
6.00
0.0
5.50
(5.0)
5.00
(10.0)
4.50
(15.0)
(20.0)
4.00
(25.0)
3.50
(30.0)
3.00
Source: Bloomberg, Angel Research
Source: RBI, Angel Research
Market Outlook
March 14, 2017
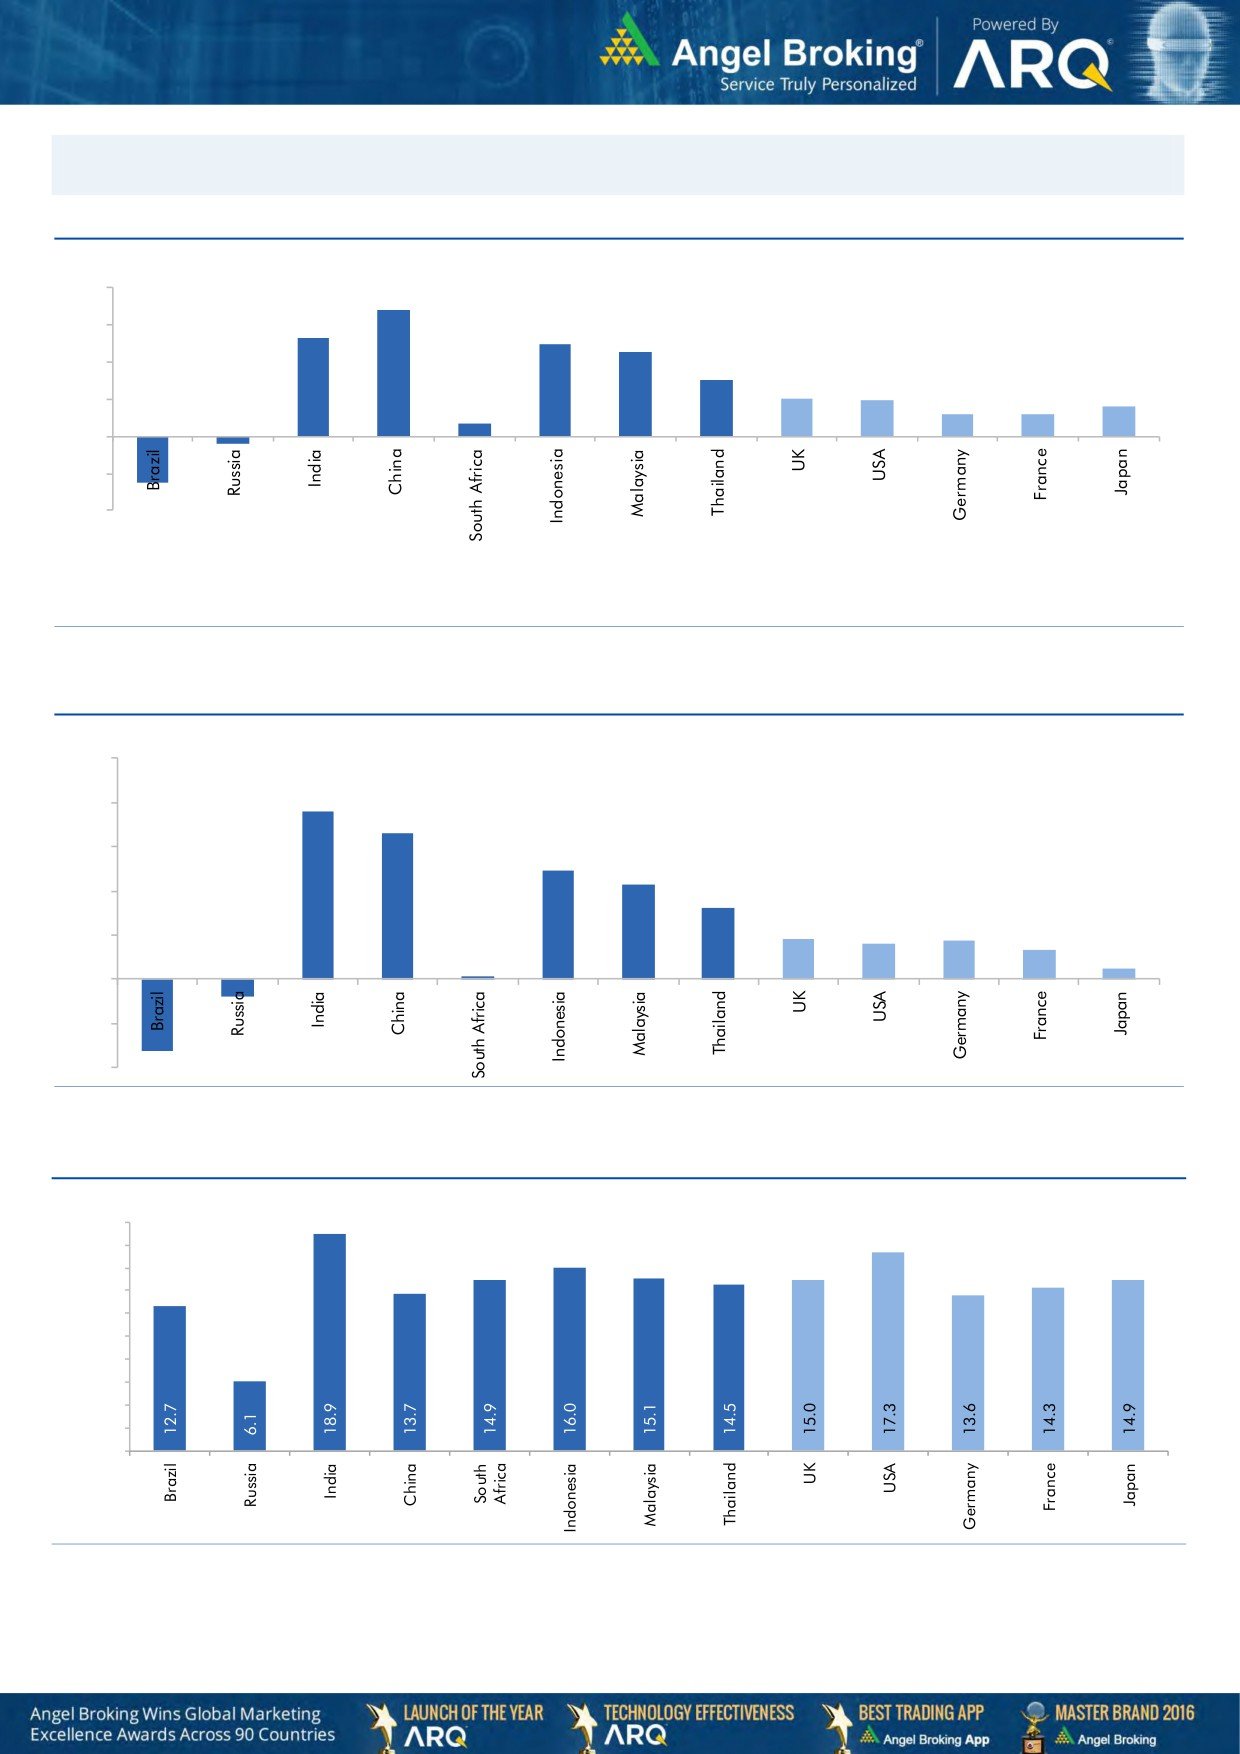
Global watch
Exhibit 1: Latest quarterly GDP Growth (%, yoy) across select developing and developed countries
(%)
8.0
6.8
0.7
5.3
6.0
4.9
4.5
4.0
3.0
2.0
1.9
1.2
1.2
1.6
2.0
-
(2.0)
(2.5)
(0.4)
(4.0)
Source: Bloomberg, Angel Research
Exhibit 2: 2016 GDP Growth projection by IMF (%, yoy) across select developing and developed countries
(%)
10.0
7.6
8.0
6.6
6.0
4.9
4.3
4.0
3.2
1.8
1.7
1.6
1.3
2.0
(0.8)
0.5
(3.3)
0.1
-
(2.0)
(4.0)
Source: IMF, Angel Research
Exhibit 3: One year forward P-E ratio across select developing and developed countries
(x)
20.0
18.0
16.0
14.0
12.0
10.0
8.0
6.0
4.0
2.0
-
Source: IMF, Angel Research
Market Outlook
March 14, 2017
Exhibit 4: Relative performance of indices across globe
Returns (%)
Country
Name of index
Closing price
1M
3M
1YR
Brazil
Bovespa
65,534
2.1
6.7
32.2
Russia
Micex
2,000
(9.9)
(9.4)
7.8
India
Nifty
8,935
1.9
8.3
19.5
China
Shanghai Composite
3,237
1.4
1.3
13.3
South Africa
Top 40
44,846
(0.4)
4.5
(1.7)
Mexico
Mexbol
47,101
(0.3)
0.4
6.5
Indonesia
LQ45
896
0.3
1.7
5.6
Malaysia
KLCI
1,722
2.0
6.0
1.4
Thailand
SET 50
975
(2.1)
2.5
12.7
USA
Dow Jones
20,881
4.1
6.8
21.2
UK
FTSE
7,367
1.9
6.3
20.0
Japan
Nikkei
19,634
3.8
6.1
15.8
Germany
DAX
11,990
3.0
7.1
20.5
France
CAC
5,000
3.6
5.0
12.8
Source: Bloomberg, Angel Research
Stock Watch
March 14, 2017
Company Name
Reco
CMP
Target
Mkt Cap
Sales ( Čcr )
OPM(%)
EPS (Č)
PER(x)
P/BV(x)
RoE(%)
EV/Sales(x)
(Č)
Price ( Č)
( Č cr )
FY17E FY18E
FY17E
FY18E
FY17E
FY18E
FY17E
FY18E
FY17E
FY18E
FY17E
FY18E
FY17E
FY18E
Agri / Agri Chemical
Rallis
Neutral
238
-
4,620
1,937
2,164
13.3
14.3
9.0
11.0
26.4
21.6
4.6
4.0
18.4
19.8
2.4
2.1
United Phosphorus
Neutral
704
-
35,692
15,176
17,604
18.5
18.5
37.4
44.6
18.8
15.8
3.7
3.1
21.4
21.2
2.5
2.1
Auto & Auto Ancillary
Ashok Leyland
Buy
90
111
25,698
20,021
21,915
11.6
11.9
4.5
5.3
20.1
17.0
4.1
3.6
20.6
21.5
1.2
1.1
Bajaj Auto
Neutral
2,866
-
82,937
25,093
27,891
19.5
19.2
143.9
162.5
19.9
17.6
5.6
4.8
30.3
29.4
3.0
2.7
Bharat Forge
Neutral
1,032
-
24,035
7,726
8,713
20.5
21.2
35.3
42.7
29.3
24.2
5.4
4.9
18.9
20.1
3.2
2.8
Eicher Motors
Neutral
23,357
-
63,554
16,583
20,447
17.5
18.0
598.0
745.2
39.1
31.3
13.4
10.2
41.2
38.3
3.7
2.9
Gabriel India
Accumulate
114
130
1,639
1,544
1,715
9.0
9.3
5.4
6.3
21.1
18.1
4.0
3.5
18.9
19.5
1.0
0.9
Hero Motocorp
Accumulate
3,312
3,446
66,132
28,083
30,096
15.3
15.7
171.8
187.0
19.3
17.7
6.7
5.7
30.1
27.9
2.2
2.0
Jamna Auto Industries Neutral
208
-
1,657
1,486
1,620
9.8
9.9
15.0
17.2
13.9
12.1
3.0
2.6
21.8
21.3
1.2
1.1
L G Balakrishnan & Bros Neutral
572
-
898
1,302
1,432
11.6
11.9
43.7
53.0
13.1
10.8
1.9
1.7
13.8
14.2
0.8
0.7
Mahindra and Mahindra Neutral
1,304
-
80,984
46,534
53,077
11.6
11.7
67.3
78.1
19.4
16.7
3.2
2.8
15.4
15.8
1.7
1.5
Maruti
Accumulate
5,952
6,560
179,797
67,822
83,288
16.0
16.4
253.8
312.4
23.5
19.1
5.4
4.4
23.0
22.9
2.3
1.8
Minda Industries
Neutral
433
-
3,435
2,728
3,042
9.0
9.1
68.2
86.2
6.4
5.0
1.4
1.1
23.8
24.3
1.3
1.2
Motherson Sumi
Neutral
355
-
49,842
45,896
53,687
7.8
8.3
13.0
16.1
27.2
22.1
8.8
7.0
34.7
35.4
1.2
1.0
Rane Brake Lining
Neutral
924
-
732
511
562
11.3
11.5
28.1
30.9
32.9
29.9
5.0
4.6
15.3
15.0
1.6
1.5
Setco Automotive
Neutral
35
-
467
741
837
13.0
13.0
15.2
17.0
2.3
2.1
0.4
0.3
15.8
16.3
1.0
0.9
Tata Motors
Neutral
469
-
135,402
300,209
338,549
8.9
8.4
42.7
54.3
11.0
8.6
1.8
1.5
15.6
17.2
0.6
0.5
TVS Motor
Neutral
426
-
20,215
13,390
15,948
6.9
7.1
12.8
16.5
33.3
25.7
8.3
6.6
26.3
27.2
1.5
1.3
Amara Raja Batteries
Buy
828
1,009
14,151
5,305
6,100
16.0
16.3
28.4
34.0
29.2
24.4
5.6
4.7
19.3
19.3
2.7
2.3
Exide Industries
Neutral
214
-
18,220
7,439
8,307
15.0
15.0
8.1
9.3
26.5
23.1
3.7
3.3
14.3
16.7
2.0
1.8
Apollo Tyres
Buy
179
235
9,109
12,877
14,504
14.3
13.9
21.4
23.0
8.4
7.8
1.3
1.1
16.4
15.2
0.9
0.8
Ceat
Buy
1,153
1,450
4,665
7,524
8,624
13.0
12.7
131.1
144.3
8.8
8.0
1.6
1.4
19.8
18.6
0.7
0.6
JK Tyres
Neutral
117
-
2,655
7,455
8,056
15.0
15.0
21.8
24.5
5.4
4.8
1.1
0.9
22.8
21.3
0.5
0.4
Swaraj Engines
Neutral
1,387
-
1,723
660
810
15.2
16.4
54.5
72.8
25.5
19.1
7.9
7.2
31.5
39.2
2.4
1.9
Subros
Neutral
191
-
1,148
1,488
1,681
11.7
11.9
6.4
7.2
29.9
26.7
3.2
2.9
10.8
11.4
1.0
0.9
Indag Rubber
Neutral
183
-
480
286
326
19.8
16.8
11.7
13.3
15.6
13.7
2.6
2.5
17.8
17.1
1.4
1.2
Capital Goods
ACE
Neutral
53
-
527
709
814
4.1
4.6
1.4
2.1
38.0
25.4
1.6
1.5
4.4
6.0
0.9
0.8
BEML
Neutral
1,278
-
5,323
3,451
4,055
6.3
9.2
31.4
57.9
40.7
22.1
2.4
2.2
6.3
10.9
1.7
1.4
Bharat Electronics
Neutral
1,568
-
35,015
8,137
9,169
16.8
17.2
58.7
62.5
26.7
25.1
4.1
3.7
44.6
46.3
3.2
2.9
Stock Watch
March 14, 2017
Company Name
Reco
CMP
Target
Mkt Cap
Sales ( Čcr )
OPM(%)
EPS (Č)
PER(x)
P/BV(x)
RoE(%)
EV/Sales(x)
(Č)
Price ( Č)
( Č cr )
FY17E
FY18E
FY17E
FY18E
FY17E
FY18E
FY17E
FY18E
FY17E
FY18E
FY17E
FY18E
FY17E
FY18E
Capital Goods
Voltas
Accumulate
382
407
12,632
6,511
7,514
7.9
8.7
12.9
16.3
29.6
23.4
5.3
4.7
16.7
18.5
1.7
1.5
BGR Energy
Neutral
131
-
947
16,567
33,848
6.0
5.6
7.8
5.9
16.8
22.2
1.0
0.9
4.7
4.2
0.2
0.1
BHEL
Neutral
158
-
38,684
28,797
34,742
-
2.8
2.3
6.9
68.7
22.9
1.2
1.1
1.3
4.8
1.0
0.7
Blue Star
Buy
549
634
5,245
4,283
5,077
5.9
7.3
14.9
22.1
36.9
24.8
7.2
6.0
20.4
26.4
1.3
1.1
Crompton Greaves
#VALUE!
5,777
6,120
5.9
7.0
3.3
4.5
4.4
5.9
Greaves Cotton
Neutral
162
-
3,950
1,755
1,881
16.8
16.9
7.8
8.5
20.7
19.0
4.2
3.9
20.6
20.9
1.9
1.8
Inox Wind
Neutral
179
-
3,977
5,605
6,267
15.7
16.4
24.8
30.0
7.2
6.0
2.0
1.5
25.9
24.4
0.7
0.6
KEC International
Neutral
170
-
4,359
9,294
10,186
7.9
8.1
9.9
11.9
17.1
14.3
2.5
2.2
15.6
16.3
0.7
0.6
KEI Industries
Buy
170
207
1,321
2,682
3,058
10.4
10.0
11.7
12.8
14.5
13.3
2.9
2.4
20.1
18.2
0.7
0.6
Thermax
Neutral
852
-
10,151
5,421
5,940
7.3
7.3
25.7
30.2
33.2
28.2
4.0
3.7
12.2
13.1
1.8
1.6
VATech Wabag
Buy
559
681
3,051
3,136
3,845
8.9
9.1
26.0
35.9
21.5
15.6
2.7
2.3
13.4
15.9
0.9
0.7
Cement
ACC
Neutral
1,401
-
26,314
11,225
13,172
13.2
16.9
44.5
75.5
31.5
18.6
3.0
2.8
11.2
14.2
2.4
2.0
Ambuja Cements
Neutral
229
-
45,451
9,350
10,979
18.2
22.5
5.8
9.5
39.5
24.1
3.3
3.0
10.2
12.5
4.8
4.1
India Cements
Neutral
156
-
4,803
4,364
4,997
18.5
19.2
7.9
11.3
19.8
13.8
1.4
1.4
8.0
8.5
1.9
1.6
JK Cement
Neutral
859
-
6,003
4,398
5,173
15.5
17.5
31.2
55.5
27.5
15.5
3.3
2.9
12.0
15.5
1.9
1.6
J K Lakshmi Cement
Neutral
418
-
4,917
2,913
3,412
14.5
19.5
7.5
22.5
55.7
18.6
3.4
2.9
12.5
18.0
2.2
1.9
Orient Cement
Neutral
132
-
2,707
2,114
2,558
18.5
20.5
8.1
11.3
16.3
11.7
2.4
2.0
9.0
14.0
1.9
1.5
UltraTech Cement
Neutral
3,849
-
105,639
25,768
30,385
21.0
23.5
111.0
160.0
34.7
24.1
4.4
3.9
13.5
15.8
4.2
3.5
Construction
ITNL
Neutral
100
-
3,299
8,946
10,017
31.0
31.6
8.1
9.1
12.4
11.0
0.5
0.5
4.2
5.0
3.7
3.4
KNR Constructions
Neutral
182
-
2,555
1,385
1,673
14.7
14.0
41.2
48.5
4.4
3.8
0.8
0.7
14.9
15.2
1.9
1.6
Larsen & Toubro
Accumulate
1,492
1,634
139,194
111,017
124,908
11.0
11.0
61.1
66.7
24.4
22.4
2.9
2.7
13.1
12.9
2.3
2.1
Gujarat Pipavav Port
Neutral
154
-
7,423
705
788
52.2
51.7
5.0
5.6
30.7
27.4
3.0
2.7
11.2
11.2
10.3
8.7
Nagarjuna Const.
Neutral
79
-
4,378
8,842
9,775
9.1
8.8
5.3
6.4
14.9
12.3
1.2
1.1
8.2
9.1
0.7
0.6
PNC Infratech
Buy
102
143
2,628
2,350
2,904
13.1
13.2
9.0
8.8
11.4
11.6
0.4
0.4
15.9
13.9
1.2
1.0
Simplex Infra
Neutral
276
-
1,366
6,829
7,954
10.5
10.5
31.4
37.4
8.8
7.4
0.9
0.8
9.9
13.4
0.6
0.5
Power Mech Projects
Neutral
394
-
579
1,801
2,219
12.7
14.6
72.1
113.9
5.5
3.5
1.0
0.9
16.8
11.9
0.3
0.2
Sadbhav Engineering
Accumulate
278
298
4,771
3,598
4,140
10.3
10.6
9.0
11.9
30.9
23.4
3.2
2.8
9.9
11.9
1.6
1.4
NBCC
Neutral
171
-
15,381
7,428
9,549
7.9
8.6
8.2
11.0
20.8
15.5
1.0
0.8
28.2
28.7
1.8
1.3
MEP Infra
Neutral
46
-
744
1,877
1,943
30.6
29.8
3.0
4.2
15.3
10.9
7.4
5.0
0.6
0.6
1.8
1.6
Stock Watch
March 14, 2017
Company Name
Reco
CMP
Target
Mkt Cap
Sales ( Čcr )
OPM(%)
EPS (Č)
PER(x)
P/BV(x)
RoE(%)
EV/Sales(x)
(Č)
Price ( Č)
( Č cr )
FY17E
FY18E
FY17E
FY18E
FY17E
FY18E
FY17E
FY18E
FY17E
FY18E
FY17E
FY18E
FY17E
FY18E
Construction
SIPL
Neutral
96
-
3,381
1,036
1,252
65.5
66.2
(8.4)
(5.6)
3.6
4.1
(22.8)
(15.9)
11.5
9.5
Engineers India
Neutral
145
-
9,754
1,725
1,935
16.0
19.1
11.4
13.9
12.7
10.4
1.8
1.7
13.4
15.3
4.6
4.1
Financials
Axis Bank
Accumulate
516
580
123,368
46,932
53,575
3.5
3.4
32.4
44.6
15.9
11.6
2.1
1.8
13.6
16.5
-
-
Bank of Baroda
Neutral
159
-
36,648
19,980
23,178
1.8
1.8
11.5
17.3
13.8
9.2
1.6
1.3
8.3
10.1
-
-
Canara Bank
Neutral
284
-
15,432
15,225
16,836
1.8
1.8
14.5
28.0
19.6
10.2
1.4
1.1
5.8
8.5
-
-
Can Fin Homes
Accumulate
1,976
2,128
5,261
420
526
3.5
3.5
86.5
107.8
22.9
18.3
4.9
4.0
23.6
24.1
-
-
Cholamandalam Inv. &
Buy
915
1,230
14,304
2,012
2,317
6.3
6.3
42.7
53.6
21.4
17.1
3.4
2.9
16.9
18.3
-
-
Fin. Co.
Dewan Housing Finance Accumulate
326
350
10,193
2,225
2,688
2.9
2.9
29.7
34.6
11.0
9.4
1.8
1.5
16.1
16.8
-
-
Equitas Holdings
Buy
162
235
5,475
939
1,281
11.7
11.5
5.8
8.2
28.0
19.8
2.4
2.1
10.9
11.5
-
-
Federal Bank
Neutral
85
-
14,619
8,259
8,995
3.0
3.0
4.3
5.6
19.7
15.2
1.7
1.5
8.5
10.1
-
-
HDFC
Neutral
1,373
-
217,669
11,475
13,450
3.4
3.4
45.3
52.5
30.3
26.1
5.8
5.2
20.2
20.5
-
-
HDFC Bank
Neutral
1,400
-
358,462
46,097
55,433
4.5
4.5
58.4
68.0
24.0
20.6
4.2
3.5
18.8
18.6
-
-
ICICI Bank
Buy
271
315
157,541
42,800
44,686
3.1
3.3
18.0
21.9
15.0
12.4
2.0
1.9
11.1
12.3
-
-
Lakshmi Vilas Bank
Accumulate
165
174
3,159
3,339
3,799
2.7
2.8
11.0
14.0
15.0
11.8
1.6
1.4
11.2
12.7
-
-
LIC Housing Finance
Accumulate
565
630
28,524
3,712
4,293
2.6
2.5
39.0
46.0
14.5
12.3
2.7
2.3
19.9
20.1
-
-
Punjab Natl.Bank
Neutral
141
-
30,100
23,532
23,595
2.3
2.4
6.8
12.6
20.8
11.2
3.2
2.3
3.3
6.5
-
-
RBL Bank
Neutral
470
-
17,383
1,783
2,309
2.6
2.6
12.7
16.4
37.0
28.7
4.0
3.6
12.8
13.3
-
-
Repco Home Finance
Buy
619
825
3,874
388
457
4.5
4.2
30.0
38.0
20.6
16.3
3.4
2.9
18.0
19.2
-
-
South Ind.Bank
Neutral
20
-
2,725
6,435
7,578
2.5
2.5
2.7
3.1
7.5
6.5
1.0
0.8
10.1
11.2
-
-
St Bk of India
Neutral
272
-
216,919
88,650
98,335
2.6
2.6
13.5
18.8
20.2
14.5
1.9
1.7
7.0
8.5
-
-
Union Bank
Neutral
146
-
10,023
13,450
14,925
2.3
2.3
25.5
34.5
5.7
4.2
0.8
0.7
7.5
10.2
-
-
Yes Bank
Neutral
1,480
-
62,712
8,978
11,281
3.3
3.4
74.0
90.0
20.0
16.5
3.8
3.2
17.0
17.2
-
-
FMCG
Akzo Nobel India
Accumulate
1,590
1,720
7,626
2,955
3,309
13.3
13.7
57.2
69.3
27.8
22.9
9.1
7.6
32.7
33.3
2.4
2.1
Asian Paints
Neutral
1,030
-
98,788
17,128
18,978
16.8
16.4
19.1
20.7
53.9
49.8
18.8
17.7
34.8
35.5
5.7
5.1
Britannia
Buy
3,124
3,626
37,486
9,594
11,011
14.6
14.9
80.3
94.0
38.9
33.2
16.0
12.4
41.2
-
3.7
3.2
Colgate
Accumulate
943
995
25,659
4,605
5,149
23.4
23.4
23.8
26.9
39.6
35.1
21.9
17.2
64.8
66.8
5.5
4.9
Dabur India
Accumulate
273
304
48,134
8,315
9,405
19.8
20.7
8.1
9.2
33.7
29.7
9.4
7.8
31.6
31.0
5.5
4.8
GlaxoSmith Con*
Neutral
5,341
-
22,463
4,350
4,823
21.2
21.4
179.2
196.5
29.8
27.2
7.9
6.7
27.1
26.8
4.5
4.0
Godrej Consumer
Neutral
1,613
-
54,934
10,235
11,428
18.4
18.6
41.1
44.2
39.2
36.5
8.7
7.3
24.9
24.8
5.5
4.8
Stock Watch
March 14, 2017
Company Name
Reco
CMP
Target
Mkt Cap
Sales ( Čcr )
OPM(%)
EPS (Č)
PER(x)
P/BV(x)
RoE(%)
EV/Sales(x)
(Č)
Price ( Č)
( Č cr )
FY17E FY18E
FY17E
FY18E
FY17E
FY18E
FY17E
FY18E
FY17E
FY18E
FY17E
FY18E
FY17E
FY18E
FMCG
HUL
Neutral
874
-
189,193
35,252
38,495
17.8
17.8
20.7
22.4
42.3
39.1
40.5
34.7
95.6
88.9
5.2
4.7
ITC
Accumulate
263
284
319,527
40,059
44,439
38.3
39.2
9.0
10.1
29.3
26.0
8.2
7.1
27.8
27.5
7.5
6.8
Marico
Accumulate
280
300
36,137
6,430
7,349
18.8
19.5
6.4
7.7
43.8
36.4
13.2
11.1
33.2
32.5
5.4
4.7
Nestle*
Neutral
6,144
-
59,234
10,073
11,807
20.7
21.5
124.8
154.2
49.2
39.8
20.2
18.2
34.8
36.7
5.8
4.9
Tata Global
Neutral
137
-
8,653
8,675
9,088
9.8
9.8
7.4
8.2
18.5
16.7
1.5
1.4
7.9
8.1
0.9
0.9
Procter & Gamble
Accumulate
6,743
7,369
21,887
2,939
3,342
23.2
23.0
146.2
163.7
46.1
41.2
11.7
9.7
25.3
23.5
7.1
6.2
Hygiene
IT
HCL Tech^
Buy
845
1,000
119,227
49,242
57,168
20.5
20.5
55.7
64.1
15.2
13.2
3.1
2.4
20.3
17.9
2.3
1.9
Infosys
Buy
1,020
1,249
234,311
68,350
77,326
27.0
27.0
62.5
69.4
16.3
14.7
3.5
3.2
21.3
21.6
2.8
2.5
TCS
Accumulate
2,542
2,700
500,843
119,025
133,308
27.6
27.6
131.2
145.5
19.4
17.5
6.3
5.8
32.4
33.1
3.9
3.5
Tech Mahindra
Buy
476
600
46,302
29,673
32,937
15.5
17.0
32.8
39.9
14.5
11.9
2.8
2.5
19.6
20.7
1.3
1.2
Wipro
Buy
487
583
118,372
55,440
60,430
18.1
18.1
36.1
38.9
13.5
12.5
2.4
2.2
19.0
17.6
1.8
1.6
Media
D B Corp
Neutral
381
-
7,008
2,297
2,590
27.4
28.2
21.0
23.4
18.2
16.3
4.2
3.7
23.7
23.1
2.8
2.4
HT Media
Neutral
83
-
1,942
2,693
2,991
12.6
12.9
7.9
9.0
10.6
9.3
0.9
0.8
7.8
8.3
0.3
0.2
Jagran Prakashan
Buy
188
225
6,152
2,355
2,635
28.0
28.0
10.8
12.5
17.4
15.1
3.8
3.3
21.7
21.7
2.6
2.3
Sun TV Network
Neutral
745
-
29,347
2,850
3,265
70.1
71.0
26.2
30.4
28.4
24.5
7.3
6.4
24.3
25.6
9.9
8.5
Hindustan Media
Neutral
274
-
2,014
1,016
1,138
24.3
25.2
27.3
30.1
10.1
9.1
1.9
1.7
16.2
15.8
1.3
1.1
Ventures
TV Today Network
Buy
255
344
1,520
567
645
26.7
27.0
15.4
18.1
16.6
14.1
2.5
2.2
14.9
15.2
2.3
1.9
Metals & Mining
Coal India
Neutral
317
-
196,496
84,638
94,297
21.4
22.3
24.5
27.1
12.9
11.7
5.4
5.1
42.6
46.0
1.8
1.7
Hind. Zinc
Neutral
284
-
120,126
14,252
18,465
55.9
48.3
15.8
21.5
18.0
13.2
2.9
2.6
17.0
20.7
8.7
6.7
Hindalco
Neutral
188
-
38,755
107,899
112,095
7.4
8.2
9.2
13.0
20.4
14.4
1.0
0.9
4.8
6.6
0.9
0.8
JSW Steel
Neutral
176
-
42,531
53,201
58,779
16.1
16.2
130.6
153.7
1.4
1.1
0.2
0.2
14.0
14.4
1.6
1.4
NMDC
Neutral
140
-
44,247
6,643
7,284
44.4
47.7
7.1
7.7
19.7
18.2
1.7
1.7
8.8
9.2
4.5
4.0
SAIL
Neutral
59
-
24,450
47,528
53,738
(0.7)
2.1
(1.9)
2.6
22.8
0.6
0.6
(1.6)
3.9
1.4
1.2
Vedanta
Neutral
249
-
73,673
71,744
81,944
19.2
21.7
13.4
20.1
18.5
12.4
1.6
1.4
8.4
11.3
1.4
1.1
Tata Steel
Neutral
468
-
45,433
121,374
121,856
7.2
8.4
18.6
34.3
25.2
13.6
1.6
1.4
6.1
10.1
1.0
1.0
Oil & Gas
Cairn India
Neutral
278
-
52,206
9,127
10,632
4.3
20.6
8.8
11.7
31.6
23.8
1.0
1.0
3.3
4.2
7.3
6.1
GAIL
Neutral
378
-
64,007
56,220
65,198
9.3
10.1
27.1
33.3
14.0
11.4
1.3
1.2
9.3
10.7
1.3
1.1
ONGC
Neutral
191
-
245,628
137,222
152,563
15.0
21.8
19.5
24.1
9.8
7.9
0.8
0.8
8.5
10.1
2.1
1.8
Indian Oil Corp
Neutral
372
-
180,858
373,359
428,656
5.9
5.5
54.0
59.3
6.9
6.3
1.1
1.0
16.0
15.6
0.6
0.6
Stock Watch
March 14, 2017
Company Name
Reco
CMP
Target
Mkt Cap
Sales ( Čcr )
OPM(%)
EPS (Č)
PER(x)
P/BV(x)
RoE(%)
EV/Sales(x)
(Č)
Price ( Č)
( Č cr )
FY17E FY18E
FY17E
FY18E
FY17E
FY18E
FY17E
FY18E
FY17E
FY18E
FY17E
FY18E
FY17E
FY18E
Oil & Gas
Reliance Industries
Neutral
1,281
-
415,684
301,963
358,039
12.1
12.6
87.7
101.7
14.6
12.6
1.5
1.4
10.7
11.3
1.9
1.5
Pharmaceuticals
Alembic Pharma
Accumulate
624
689
11,762
3,483
4,244
20.2
21.4
24.3
33.6
25.7
18.6
5.9
4.7
25.5
25.3
3.2
2.5
Alkem Laboratories Ltd
Accumulate
1,970
2,257
23,554
6,065
7,009
18.7
20.0
80.2
92.0
24.6
21.4
5.5
4.6
22.5
21.6
3.9
3.3
Aurobindo Pharma
Buy
655
877
38,326
15,720
18,078
23.7
23.7
41.4
47.3
15.8
13.9
4.1
3.2
29.6
26.1
2.7
2.3
Aventis*
Neutral
4,247
-
9,782
2,277
2,597
17.3
18.3
149.4
172.0
28.4
24.7
4.7
3.8
25.1
28.8
4.0
3.3
Cadila Healthcare
Neutral
438
-
44,845
10,429
12,318
17.7
21.6
13.1
19.2
33.4
22.8
7.0
5.6
22.8
27.1
4.4
3.6
Cipla
Sell
588
465
47,295
15,378
18,089
15.7
16.8
19.3
24.5
30.5
24.0
3.6
3.2
12.3
13.9
3.3
2.7
Dr Reddy's
Neutral
2,720
-
45,059
16,043
18,119
18.0
23.0
78.6
130.9
34.6
20.8
3.4
3.0
10.1
15.2
2.6
2.5
Dishman Pharma
Neutral
231
-
3,725
1,718
1,890
22.7
22.8
9.5
11.3
24.3
20.4
2.4
2.1
10.1
10.9
2.7
2.3
GSK Pharma*
Neutral
2,700
-
22,866
2,800
3,290
10.2
20.6
32.2
60.3
83.8
44.8
15.5
15.3
17.2
34.5
7.9
6.8
Indoco Remedies
Reduce
261
240
2,401
1,112
1,289
16.2
18.2
11.6
16.0
22.5
16.3
3.6
3.0
17.0
20.1
2.3
1.9
Ipca labs
Accumulate
546
613
6,888
3,258
3,747
12.8
15.3
12.1
19.2
45.1
28.4
2.8
2.6
6.4
9.5
2.3
2.0
Lupin
Buy
1,447
1,809
65,314
15,912
18,644
26.4
26.7
58.1
69.3
24.9
20.9
4.8
4.0
21.4
20.9
4.2
3.4
Sun Pharma
Buy
684
847
163,999
31,129
35,258
32.0
32.9
30.2
35.3
22.6
19.4
3.7
3.0
20.0
20.1
4.9
4.1
Power
Tata Power
Neutral
82
-
22,166
36,916
39,557
17.4
27.1
5.1
6.3
16.1
13.0
1.4
1.3
9.0
10.3
1.6
1.5
NTPC
Neutral
157
-
129,495
86,605
95,545
17.5
20.8
11.8
13.4
13.3
11.7
1.4
1.3
10.5
11.1
2.8
2.8
Power Grid
Accumulate
193
223
100,734
25,315
29,193
88.2
88.7
14.2
17.2
13.6
11.2
2.1
1.8
15.2
16.1
8.7
7.8
Real Estate
Prestige Estate
Buy
166
210
6,208
4,707
5,105
25.2
26.0
10.3
13.0
16.1
12.7
1.3
1.2
10.3
10.2
2.5
2.2
MLIFE
Buy
373
522
1,532
1,152
1,300
22.7
24.6
29.9
35.8
12.5
10.4
0.9
0.9
7.6
8.6
2.0
1.7
Telecom
Bharti Airtel
Neutral
365
-
145,825
105,086
114,808
34.5
34.7
12.2
16.4
29.9
22.2
2.0
1.9
6.8
8.4
2.3
2.0
Idea Cellular
Neutral
104
-
37,602
40,133
43,731
37.2
37.1
6.4
6.5
16.3
16.1
1.4
1.3
8.2
7.6
2.0
1.7
zOthers
Abbott India
Neutral
4,480
-
9,520
3,153
3,583
14.1
14.4
152.2
182.7
29.4
24.5
144.5
123.4
25.6
26.1
2.7
2.3
Asian Granito
Buy
286
351
859
1,060
1,169
12.2
12.5
12.7
15.9
22.6
18.0
2.1
1.9
9.5
10.7
1.1
1.0
Bajaj Electricals
Neutral
296
-
2,992
4,801
5,351
5.7
6.2
10.4
13.7
28.4
21.6
3.5
3.1
12.4
14.5
0.6
0.5
Banco Products (India)
Neutral
201
-
1,438
1,353
1,471
12.3
12.4
14.5
16.3
13.9
12.3
19.1
17.3
14.5
14.6
1.0
105.6
Coffee Day Enterprises
Neutral
234
-
4,814
2,964
3,260
20.5
21.2
4.7
8.0
-
29.2
2.7
2.5
5.5
8.5
2.0
1.8
Ltd
Competent Automobiles Neutral
169
-
104
1,137
1,256
3.1
2.7
28.0
23.6
6.0
7.1
32.4
29.3
14.3
11.5
0.1
0.1
Elecon Engineering
Neutral
52
-
586
1,482
1,660
13.7
14.5
3.9
5.8
13.4
9.0
3.1
2.9
7.8
10.9
0.7
0.6
Finolex Cables
Neutral
449
-
6,861
2,883
3,115
12.0
12.1
14.2
18.6
31.6
24.1
16.8
14.7
15.8
14.6
2.0
1.8
Stock Watch
March 14, 2017
Company Name
Reco
CMP
Target
Mkt Cap
Sales ( Čcr )
OPM(%)
EPS (Č)
PER(x)
P/BV(x)
RoE(%)
EV/Sales(x)
(Č)
Price ( Č)
( Č cr )
FY17E
FY18E
FY17E
FY18E
FY17E
FY18E
FY17E
FY18E
FY17E
FY18E
FY17E
FY18E
FY17E
FY18E
zOthers
Garware Wall Ropes
Neutral
686
-
1,501
863
928
15.1
15.2
36.4
39.4
18.9
17.4
3.4
2.9
17.5
15.9
1.7
1.5
Goodyear India*
Neutral
709
-
1,636
1,598
1,704
10.4
10.2
49.4
52.6
14.4
13.5
66.3
58.1
18.2
17.0
0.7
97.7
Hitachi
Neutral
1,505
-
4,092
2,081
2,433
8.8
8.9
33.4
39.9
45.1
37.7
36.4
30.3
22.1
21.4
2.0
1.6
HSIL
Neutral
324
-
2,343
2,384
2,515
15.8
16.3
15.3
19.4
21.2
16.7
21.1
18.1
7.8
9.3
1.2
1.1
Interglobe Aviation
Neutral
871
-
31,488
21,122
26,005
14.5
27.6
110.7
132.1
7.9
6.6
47.1
33.6
168.5
201.1
1.5
1.2
Jyothy Laboratories
Neutral
374
-
6,798
1,440
2,052
11.5
13.0
8.5
10.0
44.0
37.4
10.7
9.9
18.6
19.3
5.0
3.5
Kirloskar Engines India
Neutral
383
-
5,539
2,554
2,800
9.9
10.0
10.5
12.1
36.5
31.7
15.3
14.4
10.7
11.7
1.8
1.6
Ltd
Linc Pen & Plastics
Neutral
255
-
377
382
420
9.3
9.5
13.5
15.7
18.9
16.2
3.2
2.8
17.1
17.3
1.1
0.9
M M Forgings
Neutral
487
-
588
546
608
20.4
20.7
41.3
48.7
11.8
10.0
66.8
59.1
16.6
17.0
0.9
0.8
Manpasand Bever.
Neutral
708
-
4,051
836
1,087
19.6
19.4
16.9
23.8
41.9
29.7
5.0
4.4
12.0
14.8
4.6
3.5
Mirza International
Buy
88
107
1,063
963
1,069
17.2
18.0
6.1
7.5
14.4
11.8
2.2
1.9
15.0
15.7
1.3
1.2
MT Educare
Neutral
86
-
344
366
417
17.7
18.2
9.4
10.8
9.2
8.0
2.0
1.8
22.2
22.3
0.9
0.7
Narayana Hrudaya
Neutral
311
-
6,363
1,873
2,166
11.5
11.7
2.6
4.0
117.7
78.5
7.2
6.5
6.1
8.3
3.5
3.0
Navkar Corporation
Buy
165
265
2,356
369
561
42.9
42.3
6.9
11.5
23.9
14.3
1.7
1.5
7.4
10.5
7.2
4.7
Navneet Education
Neutral
144
-
3,363
1,062
1,147
24.0
24.0
6.1
6.6
23.6
21.7
4.9
4.3
20.6
19.8
3.3
3.0
Nilkamal
Neutral
1,906
-
2,844
1,995
2,165
10.7
10.4
69.8
80.6
27.3
23.6
108.9
94.6
16.6
16.5
1.4
1.3
Page Industries
Neutral
14,265
-
15,911
2,450
3,124
20.1
17.6
299.0
310.0
47.7
46.0
317.7
242.5
47.1
87.5
6.6
5.2
Parag Milk Foods
Neutral
215
-
1,807
1,919
2,231
9.3
9.6
9.5
12.9
22.8
16.6
3.5
2.9
15.5
17.5
1.1
0.9
Quick Heal
Neutral
241
-
1,686
408
495
27.3
27.0
7.7
8.8
31.1
27.4
2.9
2.9
9.3
10.6
3.3
2.7
Radico Khaitan
Buy
125
147
1,662
1,667
1,824
13.0
13.2
6.7
8.2
18.8
15.3
1.7
1.6
9.0
10.2
1.4
1.2
Relaxo Footwears
Neutral
444
-
5,334
2,085
2,469
9.2
8.2
7.6
8.0
58.7
55.9
22.8
19.4
17.9
18.8
2.8
2.4
S H Kelkar & Co.
Neutral
288
-
4,161
1,036
1,160
15.1
15.0
6.1
7.2
47.1
40.1
5.0
4.6
10.7
11.5
3.9
3.5
Siyaram Silk Mills
Accumulate
1,660
1,872
1,556
1,652
1,857
11.6
11.7
92.4
110.1
18.0
15.1
2.6
2.3
14.7
15.2
1.2
1.0
Styrolution ABS India*
Neutral
605
-
1,064
1,440
1,537
9.2
9.0
40.6
42.6
14.9
14.2
38.1
34.6
12.3
11.6
0.7
0.6
Surya Roshni
Neutral
182
-
800
3,342
3,625
7.8
7.5
17.3
19.8
10.6
9.2
20.1
16.1
10.5
10.8
0.5
0.5
Team Lease Serv.
Neutral
880
-
1,505
3,229
4,001
1.5
1.8
22.8
32.8
38.7
26.8
4.1
3.6
10.7
13.4
0.4
0.3
The Byke Hospitality
Neutral
169
-
678
287
384
20.5
20.5
7.6
10.7
22.3
15.8
4.7
3.8
20.7
23.5
2.4
1.8
Transport Corporation of
Neutral
205
-
1,567
2,671
2,911
8.5
8.8
13.9
15.7
14.8
13.1
2.0
1.8
13.7
13.8
0.7
0.6
India
TVS Srichakra
Neutral
3,010
-
2,305
2,304
2,614
13.7
13.8
231.1
266.6
13.0
11.3
338.2
266.3
33.9
29.3
1.0
0.8
Stock Watch
March 14, 2017
Company Name
Reco
CMP
Target Mkt Cap
Sales ( Čcr )
OPM(%)
EPS (Č)
PER(x)
P/BV(x)
RoE(%)
EV/Sales(x)
(Č)
Price ( Č)
( Č cr )
FY17E FY18E FY17E FY18E FY17E FY18E FY17E FY18E FY17E FY18E FY17E FY18E FY17E FY18E
zOthers
UFO Moviez
Neutral
399
-
1,102
619
685
33.2
33.4
30.0
34.9
13.3
11.4
1.8
1.6
13.8
13.9
1.5
1.2
Visaka Industries
Neutral
240
-
382
1,051
1,138
10.3
10.4
21.0
23.1
11.4
10.4
30.8
28.9
9.0
9.2
0.6
0.6
VRL Logistics
Neutral
300
-
2,738
1,902
2,119
16.7
16.6
14.6
16.8
20.6
17.8
4.5
4.0
21.9
22.2
1.5
1.3
Wonderla Holidays
Neutral
380
-
2,147
287
355
38.0
40.0
11.3
14.2
33.6
26.8
4.8
4.2
21.4
23.9
7.1
5.8
Source: Company, Angel Research; Note: *December year end; #September year end; &October year end; Price as on March 10, 2017
Market Outlook
March 14, 2017
Research Team Tel: 022 - 39357800
DISCLAIMER
Angel Broking Private Limited (hereinafter referred to as “Angel”) is a registered Member of National Stock Exchange of India
Limited,Bombay Stock Exchange Limited and Metropolitan Stock Exchange Limited. It is also registered as a Depository Participant with
CDSL and Portfolio Manager with SEBI. It also has registration with AMFI as a Mutual Fund Distributor. Angel Broking Private Limited is a
registered entity with SEBI for Research Analyst in terms of SEBI (Research Analyst) Regulations, 2014 vide registration number
INH000000164. Angel or its associates has not been debarred/ suspended by SEBI or any other regulatory authority for accessing
/dealing in securities Market. Angel or its associates/analyst has not received any compensation / managed or
co-managed public offering of securities of the company covered by Analyst during the past twelve months.
This document is solely for the personal information of the recipient, and must not be singularly used as the basis of any investment
decision. Nothing in this document should be construed as investment or financial advice. Each recipient of this document should make
such investigations as they deem necessary to arrive at an independent evaluation of an investment in the securities of the companies
referred to in this document (including the merits and risks involved), and should consult their own advisors to determine the merits and
risks of such an investment.
Reports based on technical and derivative analysis center on studying charts of a stock's price movement, outstanding positions and
trading volume, as opposed to focusing on a company's fundamentals and, as such, may not match with a report on a company's
fundamentals. Investors are advised to refer the Fundamental and Technical Research Reports available on our website to evaluate the
contrary view, if any.
The information in this document has been printed on the basis of publicly available information, internal data and other reliable
sources believed to be true, but we do not represent that it is accurate or complete and it should not be relied on as such, as this
document is for general guidance only. Angel Broking Pvt. Limited or any of its affiliates/ group companies shall not be in any way
responsible for any loss or damage that may arise to any person from any inadvertent error in the information contained in this report.
Angel Broking Pvt. Limited has not independently verified all the information contained within this document. Accordingly, we cannot
testify, nor make any representation or warranty, express or implied, to the accuracy, contents or data contained within this document.
While Angel Broking Pvt. Limited endeavors to update on a reasonable basis the information discussed in this material, there may be
regulatory, compliance, or other reasons that prevent us from doing so.
This document is being supplied to you solely for your information, and its contents, information or data may not be reproduced,
redistributed or passed on, directly or indirectly.
Neither Angel Broking Pvt. Limited, nor its directors, employees or affiliates shall be liable for any loss or damage that may arise from
or in connection with the use of this information.